> For the complete documentation index, see [llms.txt](https://open-data-institute.gitbook.io/data-landscape-playbook/llms.txt). Markdown versions of documentation pages are available by appending `.md` to page URLs; this page is available as [Markdown](https://open-data-institute.gitbook.io/data-landscape-playbook/play-two-map-the-data-ecosystem/create-an-ecosystem-map.md).
# Create an ecosystem map
**Once you’ve started to engage with your stakeholders, we recommend you create a** [**data ecosystem map**](https://theodi.org/article/mapping-data-ecosystems/)**.** A data ecosystem consists of the organisations, communities and people that create and benefit from the value created by the data flowing through our data infrastructure. A data ecosystem map illustrates the value exchanges in an ecosystem.
This map can be used both as a practical planning tool to manage your data ecosystem, and for communication and advocacy to demonstrate the opportunities for increasing value to particular parts of the ecosystem.
When creating a data ecosystem map, we recommend reflecting on the problem your initiative is trying to tackle. Try to frame this problem in a particular data-focused use case to optimise the mapping exercise and identify the gaps that might be addressed by building data infrastructure.
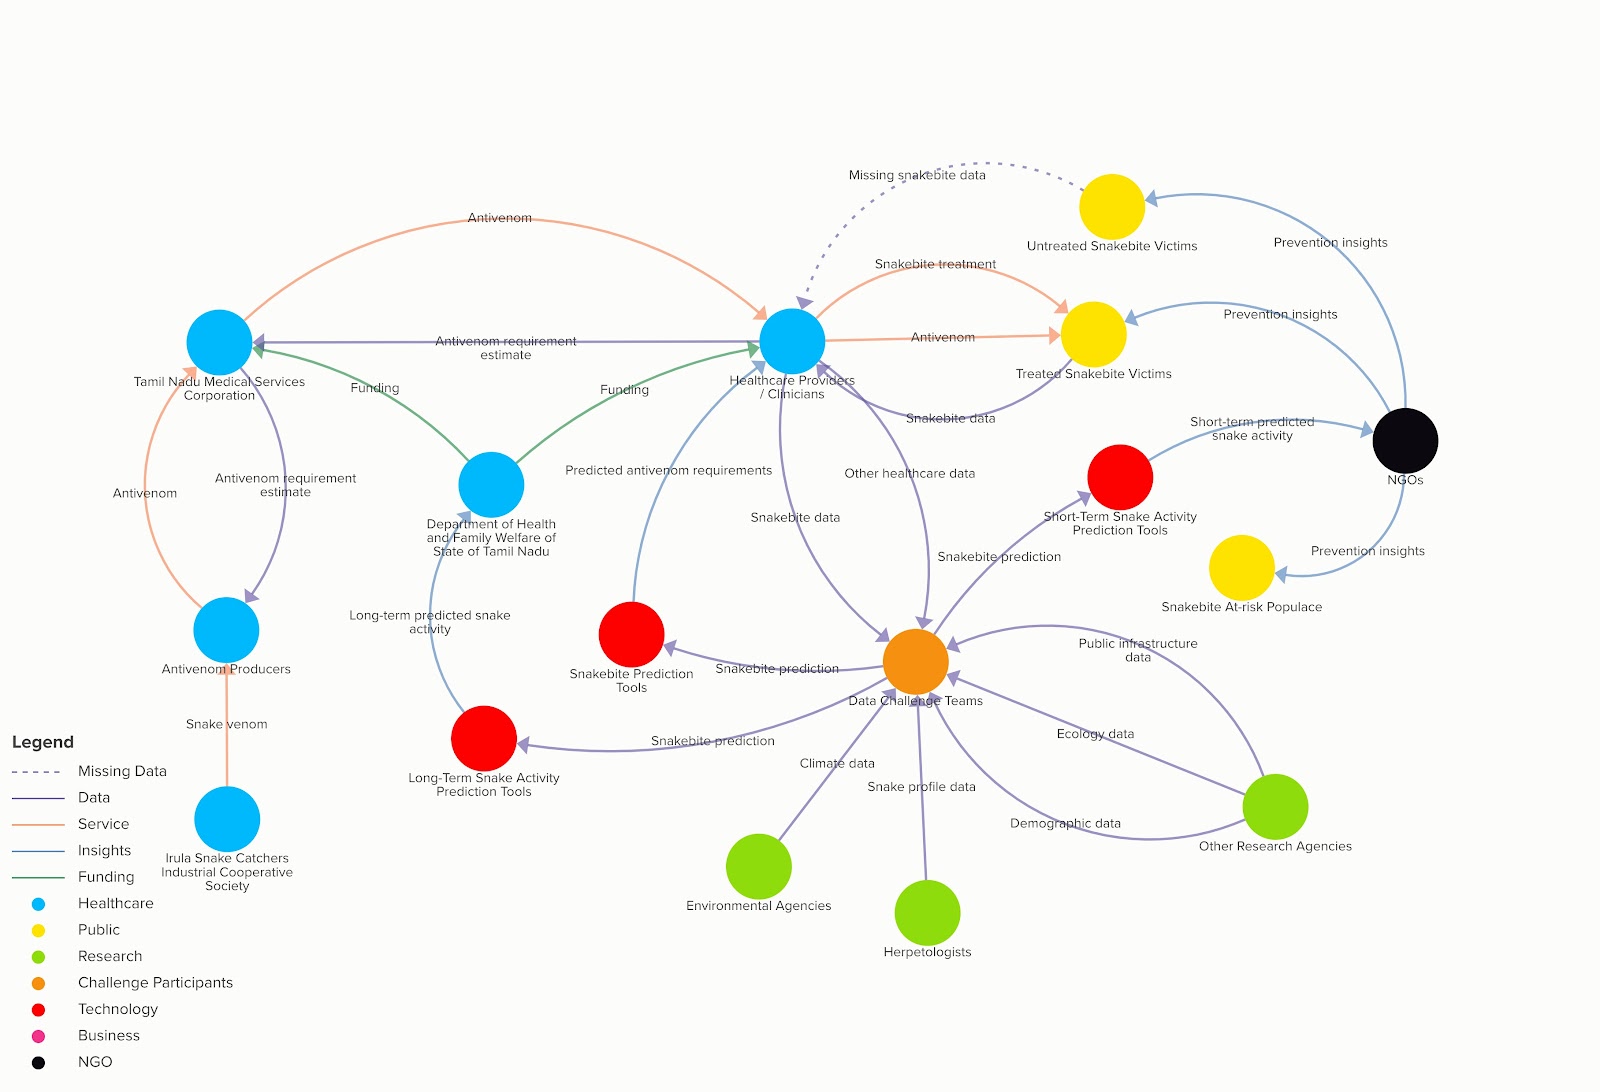
The following is an example ecosystem map for a challenge project around reducing snakebite mortality and morbidity in India:
We follow a four-step process to map create a data ecosystem map
{% tabs %}
{% tab title="Map the actors and technologies" %}

**Start with the part of the ecosystem you know best**\
As you draw, start with the part of the ecosystem you know best. We recommend thinking about the most relevant organisations to your use case, including your own. Use Post-its or draw circles to plot all the people, organisations or technologies that are linked in some way to the data. It may help to think of the organisations and groups you need data from, or you provide services to. Stay with very specific examples as it ensures the representation is as realistic as possible.
{% endtab %}
{% tab title="Follow the data" %}

Now that you have some of the actors, start mapping the flows and exchanges in the ecosystem. Start with the data that is shared or used by different actors. Draw lines and add labels to indicate what data is being shared or used.
After plotting the data flows, think of other forms of tangible value, such as how money (e.g. fees and service charges) funds different activities, or how services (e.g. healthcare and energy) are provided.
{% endtab %}
{% tab title="Follow the Insights" %}

Next ask yourself, what kind of insights are being generated from data sharing, and how are these insights being shared? At this stage, describe value flows that are relatively intangible such as insights, knowledge and policy.
Many of the actors and value flows that you draw out in your data ecosystem map will feature in the next play as inputs, activities and dependencies. Keep this in mind.
{% endtab %}
{% tab title="Find opportunities" %}

One of the most valuable uses of your data ecosystem map is to find new opportunities. Look for new potential opportunities from your mapped ecosystem such as where to improve data flows, create new services or build new connections.
The opportunities you discover in your data ecosystem map can help you understand the inputs you need to access, the activities you need to undertake, and the outputs you need to create in order to achieve your desired impact. (more on the [**next page**](/data-landscape-playbook/play-two-map-the-data-ecosystem/identify-gaps-barriers-and-opportunities.md))
{% endtab %}
{% endtabs %}
For additional guidance, tips and examples regarding data ecosystem mapping, check out our free webinar [**Data ecosystem mapping: plotting the journey from data to value for your business**](https://theodi.org/event_series/data-ecosystem-mapping-plotting-the-journey-from-data-to-value-for-your-business/) **from** the [**ODI webinar collection**](https://theodi.org/events/webinars/)**.**
{% hint style="success" %}
[**Download a PDF of our Data Ecosystem Mapping tool to print out**](http://theodi.org/wp-content/uploads/2019/07/ODI-Data-Ecosystem-Mapping-A1-fold-to-A5-2019-1.pdf?__cf_chl_jschl_tk__=7323a7adca7b272b7034b99248d53580be8902fa-1612978530-0-AeBMZrmaeHseKxkgawxTR4XAHo7bYjGR_n471OTOYxtWKyLE3r_-EgtRz47XZQXTeRKotg470zLdUG2heWO5ll-J8D6HPEisLPR0F-xtqtDENUEGyEjJ8779zRYSL7rCDPzkwQN1e0GMu7WkJEIvZBXhGoLPWVyQl8pZ8t_G5B1xW2n6wdvDZS9skMXlMl_H7G-_NpM97EOGBwgY_u13p5KYrTKmUzNQii1rFXQSnf3z4ebZlNKUgCI9JFx0UKA11B4TxtORKro3SDpKrsb2F5zi4B8hD90Pin1Hs1qS_5vEYsImFTn68WZqSWVd8pssDv7cdRJ87n2v9IUDrkB6-bMWsvq2Wlu3guYbnjVl9F8Pe17lcEWAEfu_OKQsjcLVN0ArFmBnbHZ-cuhODD7RcSYqi1JVIqnFntNvgNWQBUCX)
{% endhint %}